Our fleet lifecycle application provides customers with crucial answers for the difficult, but all-too-important questions that surround fleet asset replacement.
Maintain a healthy and cost efficient fleet with our Fleet Lifecycle analysis.
Our fleet lifecycle analysis determines what lifecycle achieves the lowest cost to own and maintain your fleet assets over their lifetime.
1. Know what fleet asset to replace and when.
2. Make cases for capital based off clean data.
3. Maximize your budget and mechanic hours.
How we establish your target lifecycle:
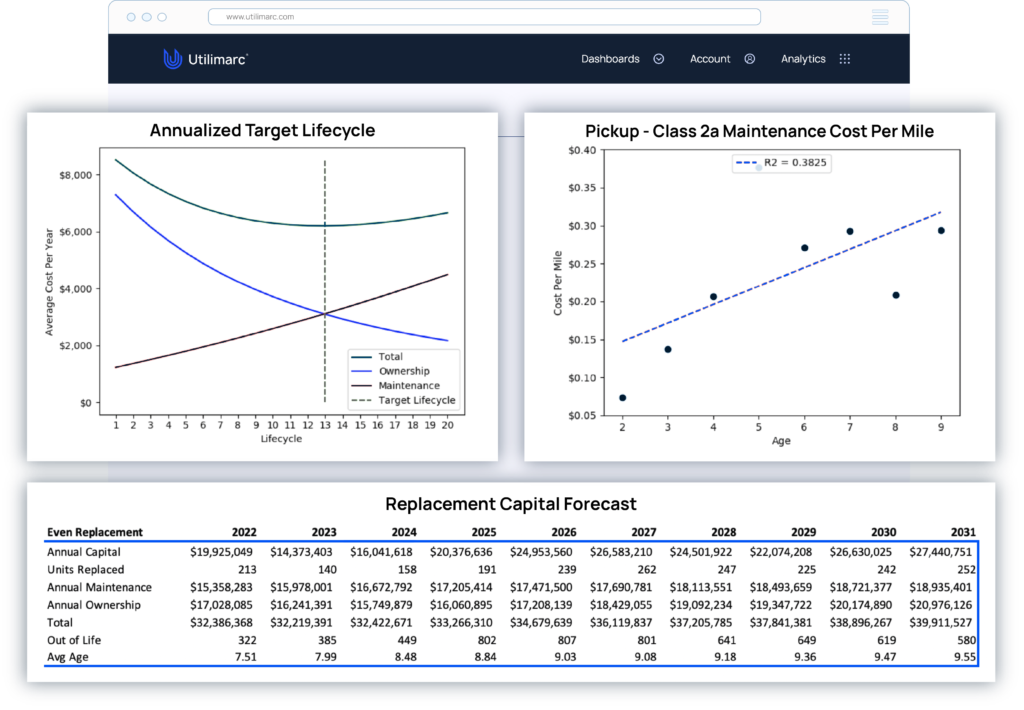
Annualized Ownership Cost
We begin by establishing each classes’ annualized ownership cost by taking the cumulative sum of each year of depreciation for the asset and dividing by the number of years the asset is in service. We map these values along a curve for each year of ownership.
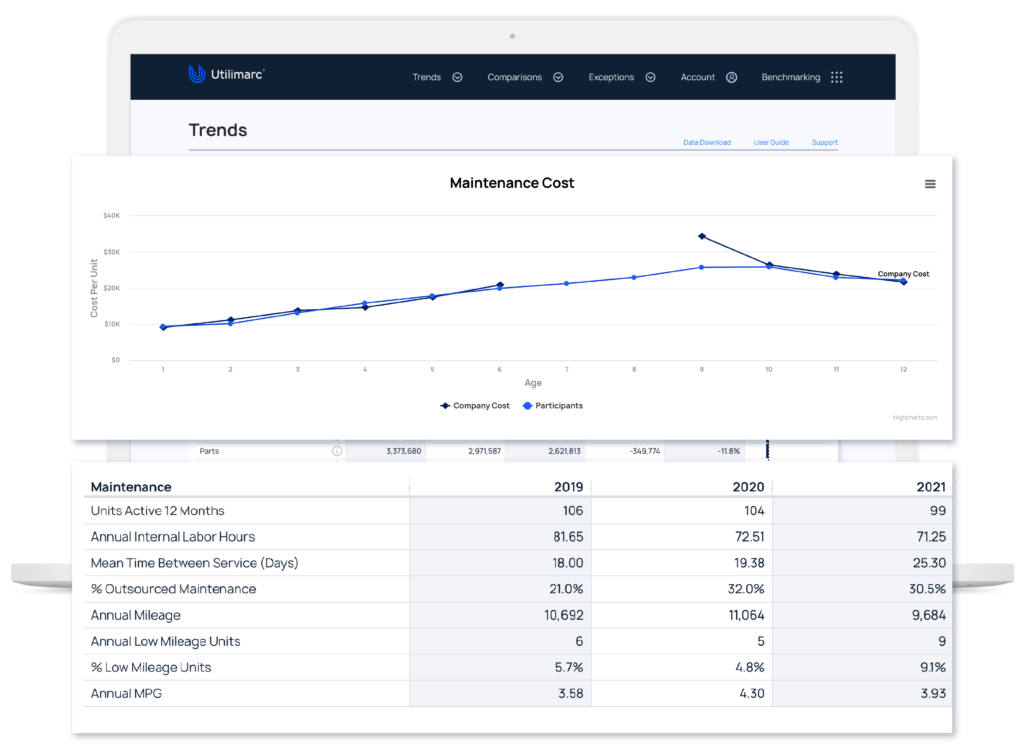
Maintenance Cost
Our maintenance cost models are class specific models based on historical, maintenance cost per mile data taken from Utilimarc’s proprietary data from over two decades of handling fleet data. These values are again mapped to a predictive line across years of ownership.
Putting it all together
We establish a target lifecycle with the lowest annualized total cost for your top vehicle classes. Minimizing annualized total cost guarantees the lowest total cost over the life of the asset.
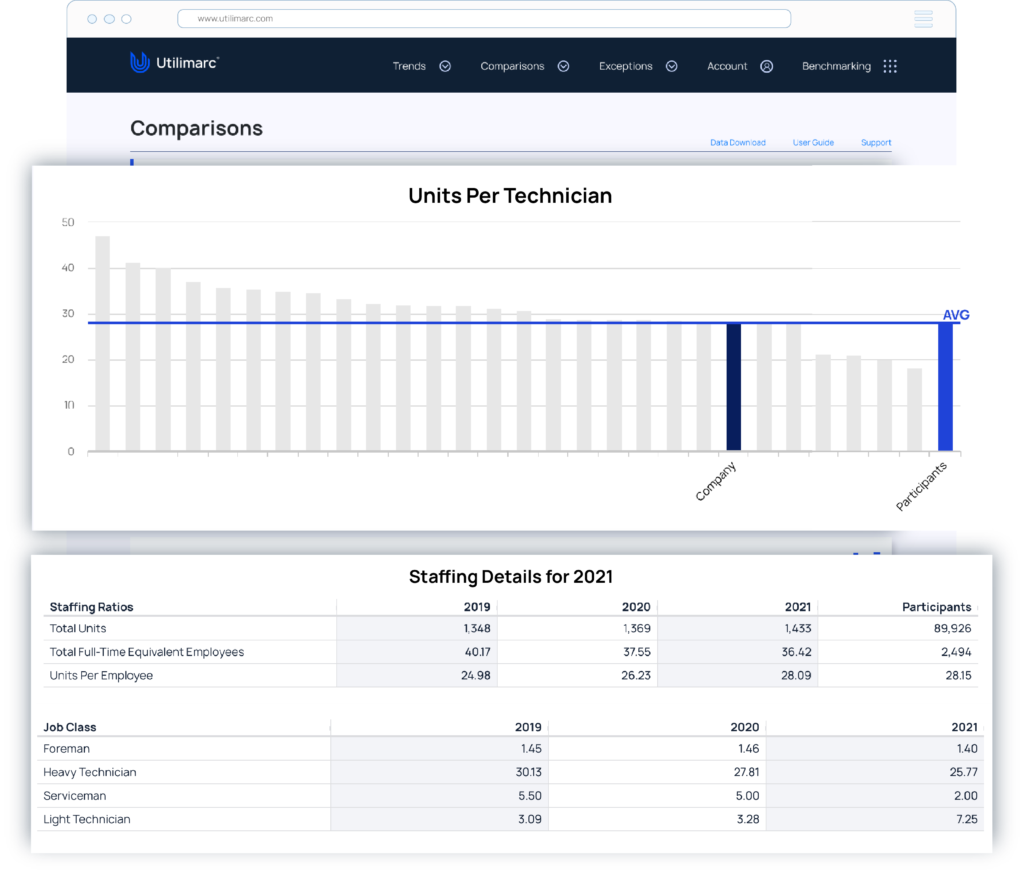
Benchmarking
Get necessary insights for optimizing technician staffing levels.
Each vehicle class has a different lifecycle – it’s even more so true as fleets transition certain classes to electric. Newer vehicles tend to have more safety features, better MPG or eMPG rates and typically lower associated costs.
Our team can help you create a reliable and repeatable replacement schedule for your vehicle assets, that will help you create a balanced fleet in key areas like:
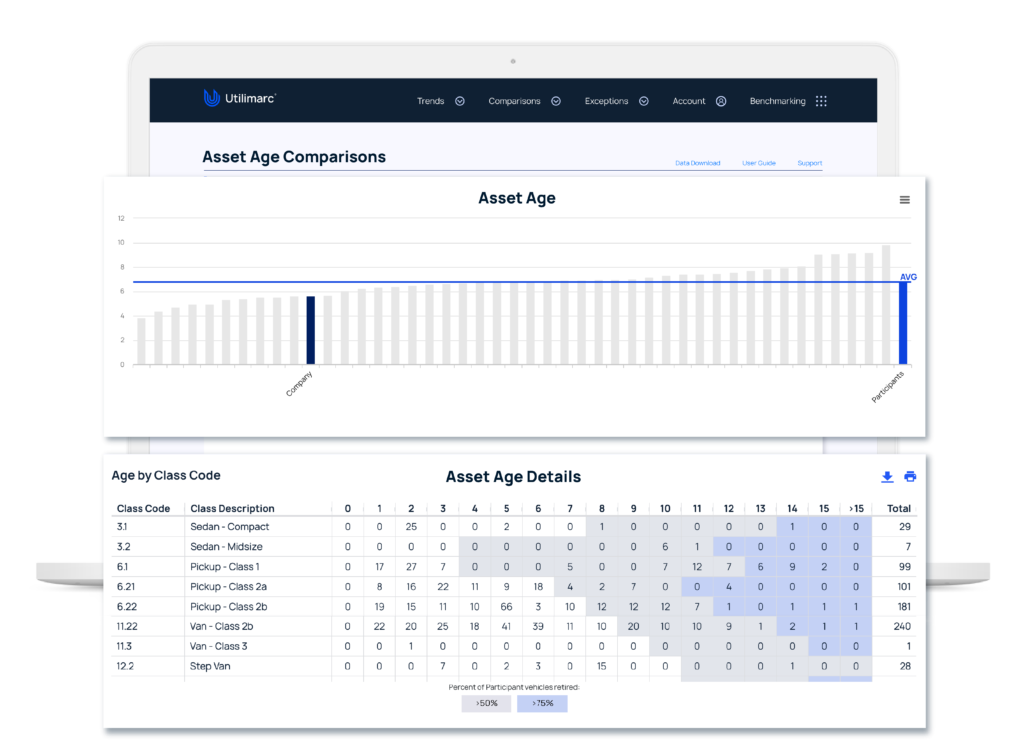
See your fleet’s overall age compared against when your industry peers replace their assets.
The Asset Age report provides an overview of the total vehicles in each class by age. The report highlights at which ages 50% and 75% of the industry has retired each vehicle in the class.
Use our tool to gain a deeper understanding of your fleet’s overall age and forecast when you may need to replace your assets. Confidently present your requests for new or replacement assets to internal stakeholders in the next budget cycle.