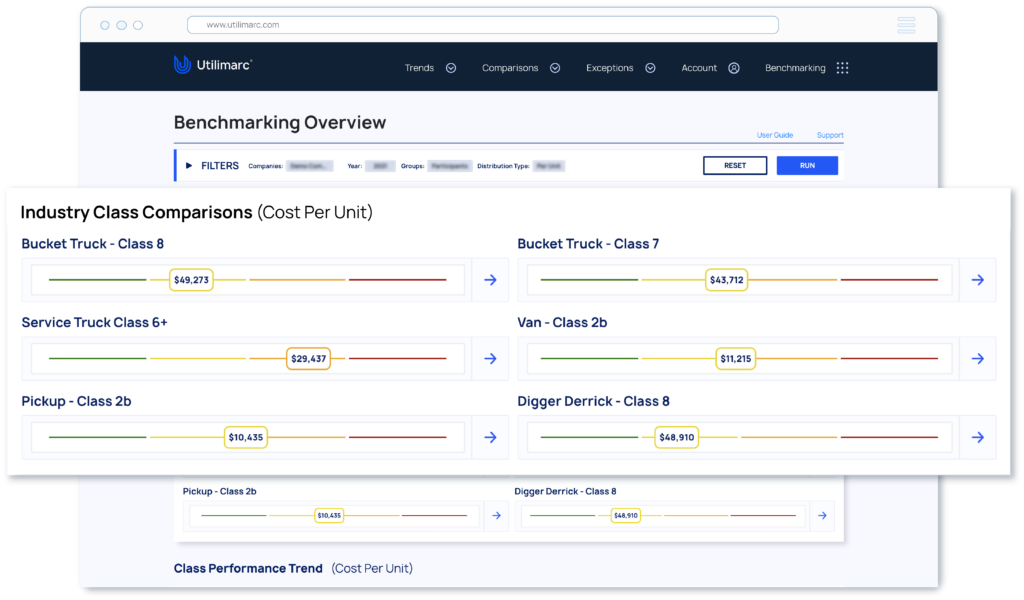
Our comparison reports allow you to compare your data against similar fleets to identify where you could improve and prove where you outperform the industry.
BenchmarkinG
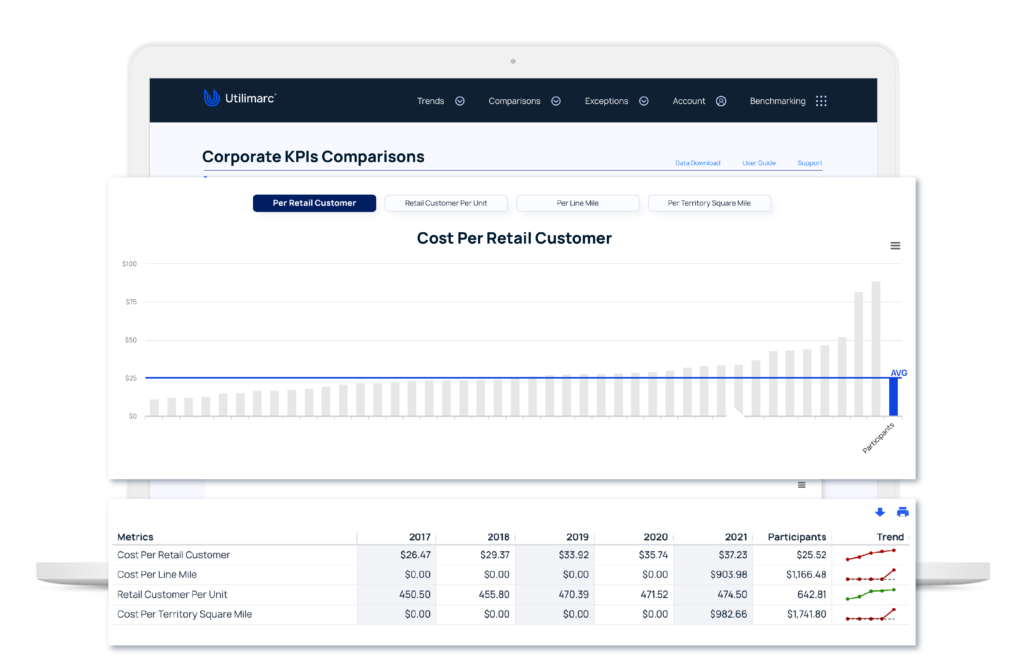
Corporate KPIs
Understand corporate key performance indicators measured against the industry standard.
How does it work?
The Corporate KPIs report shares cost to serve information and compares your numbers to the industry.
What to look for?
See your fleet’s performance over time and compared to your peers across:
Cost per retail customer
Retail customer per unit
Cost per line mile
Cost per territory square mile
The Payoff
Dive deeper into business-driven fleet metrics to identify where to improve or to prove your performance among the industry.
“Before partnering with Utilimarc I always felt that our fleet personnel were doing a good job, but now we have the data to prove it.”
Thomas Patzloff — General Services Manager LA DWP
Benchmarking
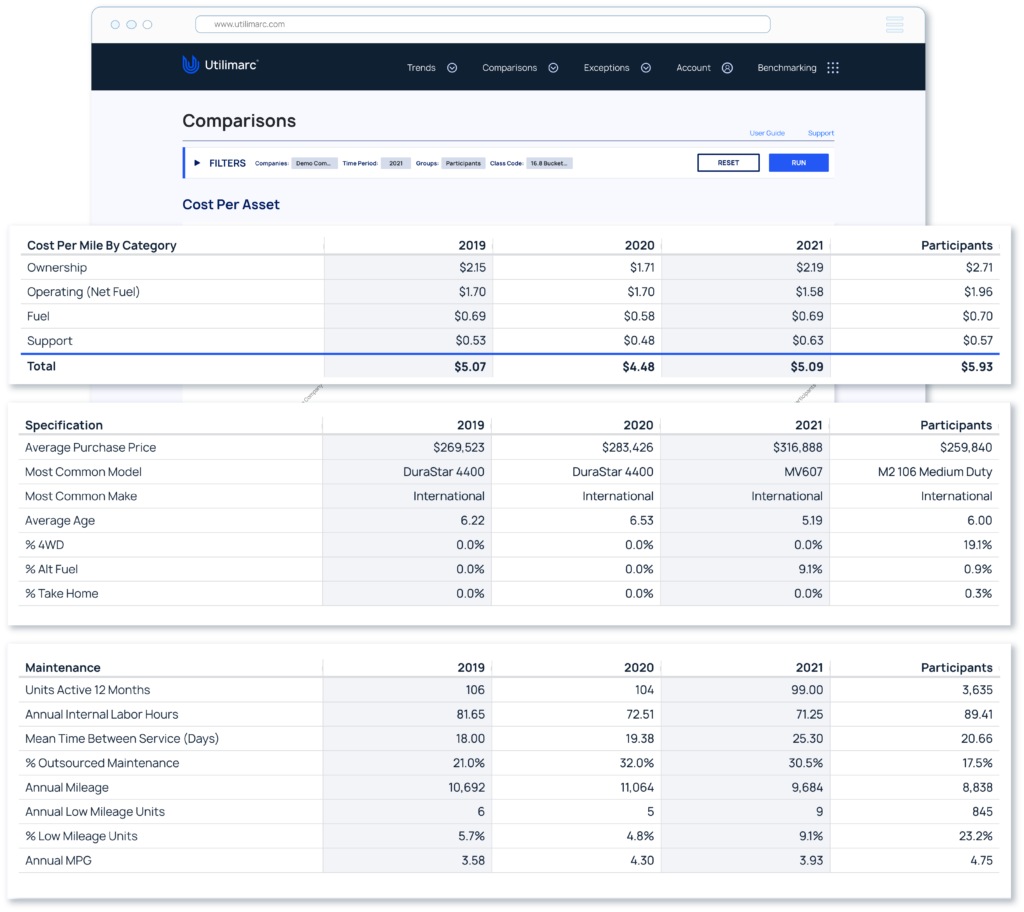
Cost Per Asset
Break down your costs per unit across all facets of fleet operation.
How does it work?
Cost per asset breaks down your total cost for each vehicle by:
Ownership
Operating (Net Fuel)
Fuel
Support
What to look for?
Follow these key vehicle cost metrics over time and see how each category and your total cost compare to the average industry costs for similar vehicles.
The Payoff
You’ll be able to key in on the leading indicators of your total cost to see the best place to focus your effort for the coming year.
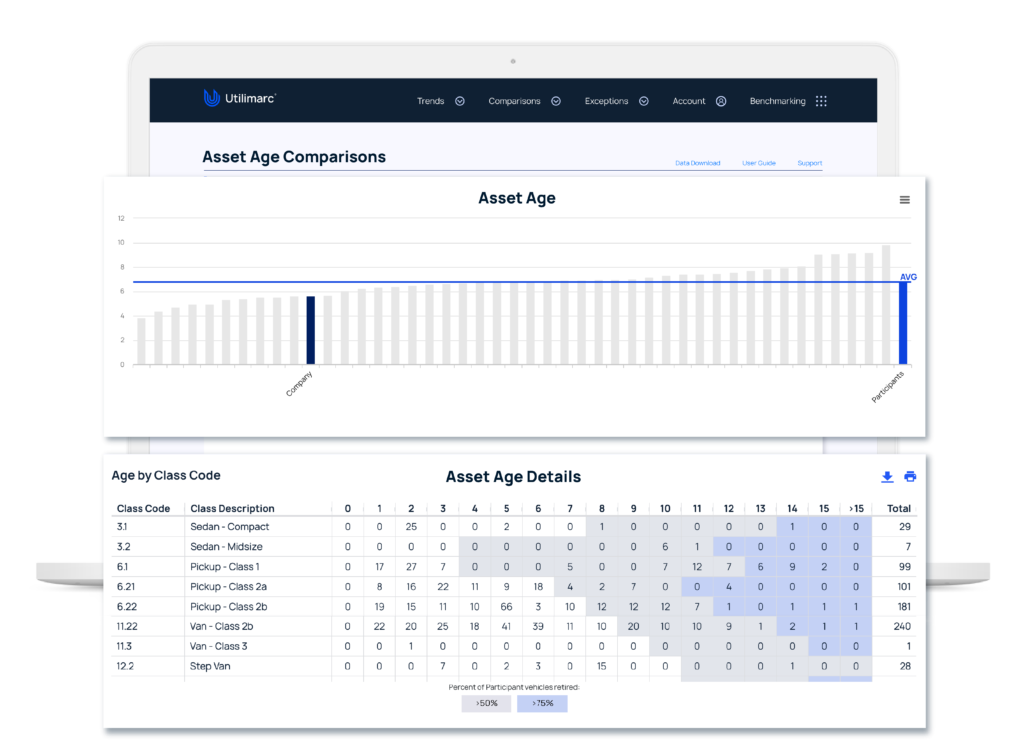
Summarize your fleet’s overall age compared against when your industry peers replace their assets.
How does it work?
The Asset Age report provides an overview of the total vehicles in each class by age. The report highlights at which ages 50% and 75% of the industry has retired each vehicle in the class.
What to look for?
Gain a deeper understanding of your fleet’s overall age and forecast when you may need to replace your assets.
The Payoff
Confidently present your requests for new or replacement assets to internal stakeholders in the next budget cycle.
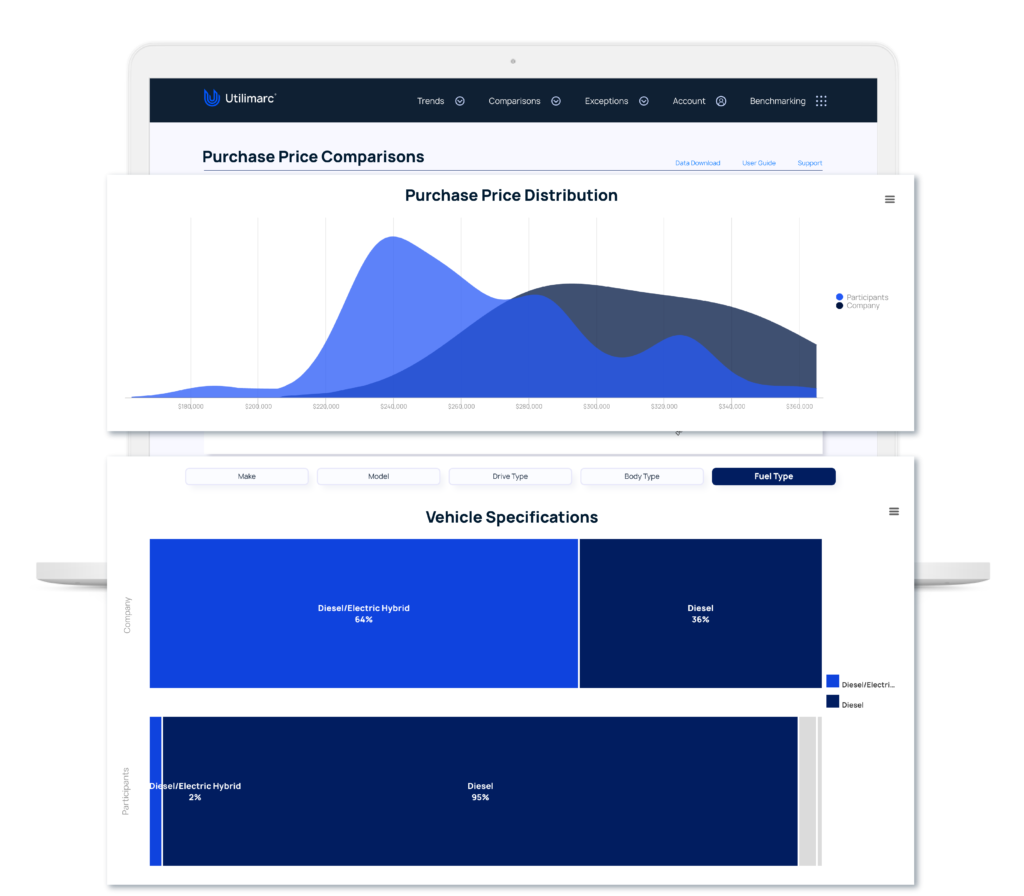
Discover the average purchase prices for fleet vehicles industry-wide.
How does it work?
The Purchase Price report displays your purchasing information for every fleet asset to deliver the average purchase price for each class of equipment compared to the industry.
What to look for?
With this report, you’ll be able to see whether you’re spending more, less or even with industry leading peers on the units within your fleet. Easily filter based on class, make, model, fuel type, and drive type for direct comparisons.
The Payoff
Understanding your average purchase price as compared to your industry peers can help you make smarter investments in your fleet.
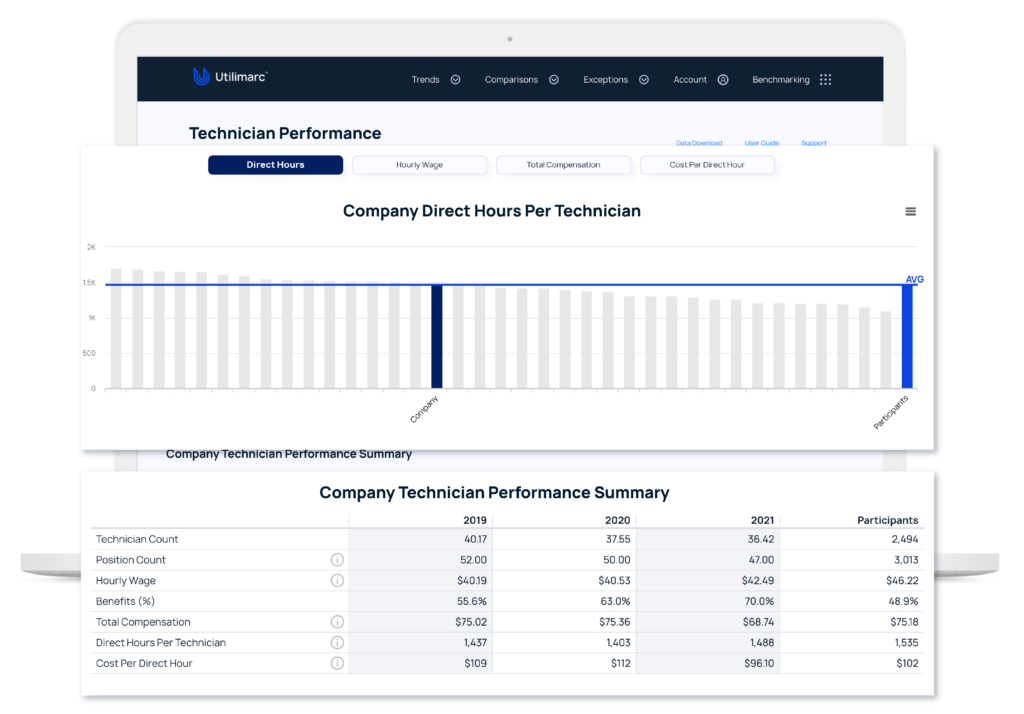
How many hours are your technicians charging per unit?
How does it work?
The Technician Billed Hours report analyzes billed hours broken down by productive hours and cost per productive hours – compared to that of your industry peers.
What to look for?
Dive into your staffing data to compare your technicians’ performance and compensation over time as compared to their peers across:
Direct hours
Hourly wage
Total compensation
Cost per direct hour
The Payoff
Make sure your garages are operating in a way that puts your productive hours per employee and cost per productive hours ahead of the industry.